
The Accordion Pilot Web UI is the browser interface built into your Accordion station. You use it to see the modules in the station, read and set channel values, chart signals, run power supplies and instruments, send bus transactions, manage calibration, files and logs, and update the firmware.
The station serves the Web UI itself. There is nothing to install on your computer.
The installed Windows application Accordion Pilot is discontinued and will no longer be updated. The Web UI covers what it did.
Requirements
-
An Accordion station running firmware 6.0 or later.
-
Any modern web browser on a computer, phone or tablet.
-
A network connection to the station. Your device must be on the same network as the station.
The Web UI does not need internet access. Fonts, icons and scripts all come from the station.
Accessing
-
Open a web browser.
-
Type the station's host name or IP address in the address bar, for example
http://accordion-01/orhttp://192.168.1.50/. -
Press Enter. The Overview page opens.
The Web UI uses the standard web port (80), so you do not need to add a port number.
The layout
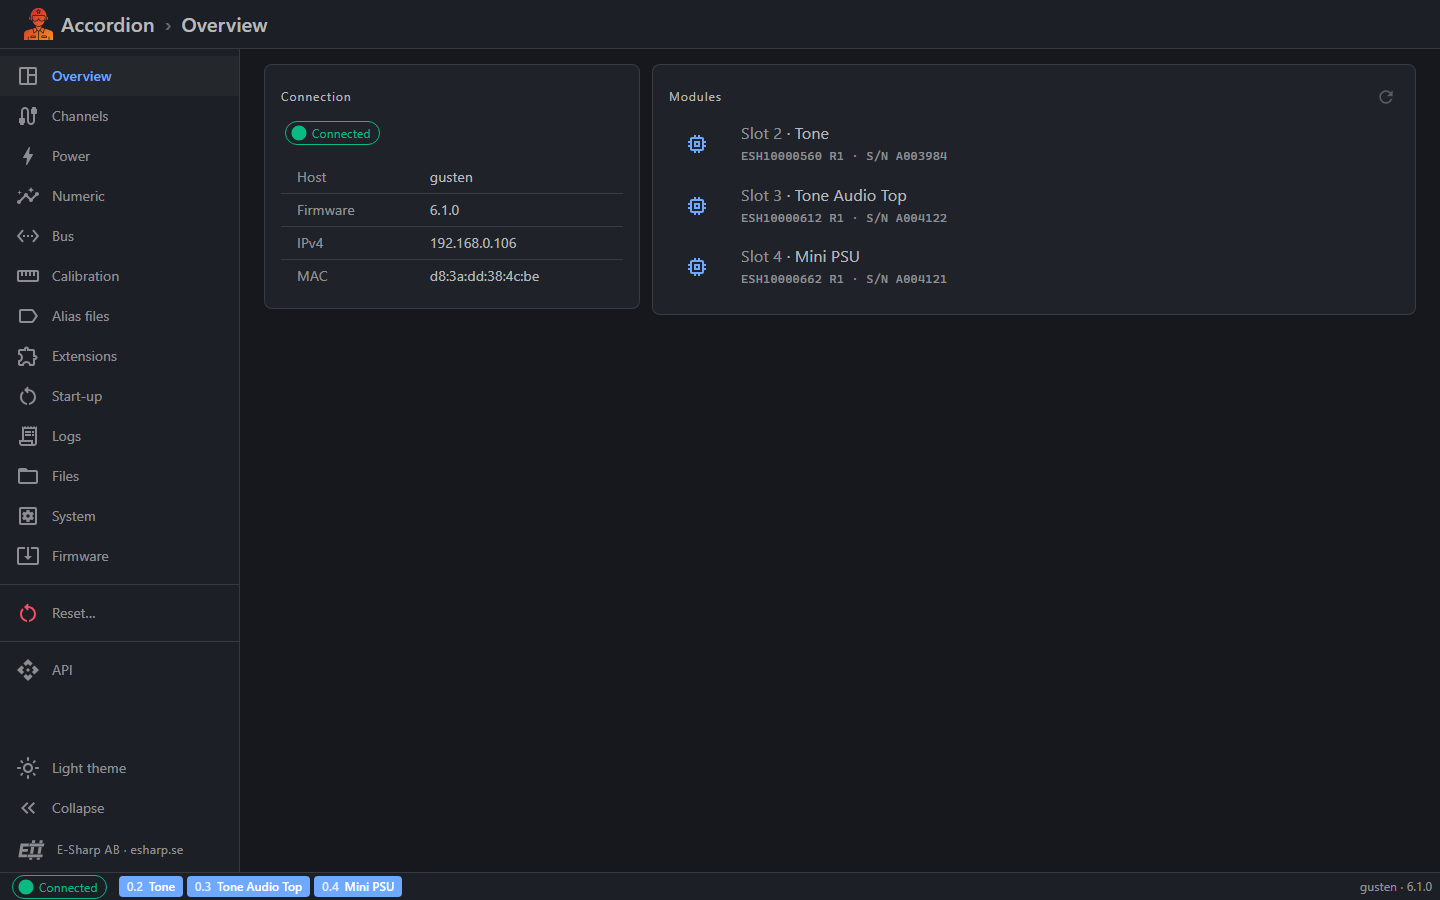
Every page has the same frame: a top bar, a side menu on the left and a status bar at the bottom.
Top bar
-
The Accordion logo and name. Click it to go back to the Overview page.
-
The name of the page you are on.
-
On a phone or a narrow window, a menu button that opens the side menu.
Side menu
The side menu lists every page. Click a page name to open it.
|
Menu item |
What it is for |
|---|---|
|
Overview |
The connection to the station and the modules in its backplane. |
|
Channels |
Every channel in the station, with live values you can read and set. |
|
Power |
One panel for each power supply in the station. |
|
PoE |
One panel for each PoE tester. Shown only when the station has one. |
|
Audio |
Record and play back on the station's audio devices. Shown only when the station has one. |
|
Environment |
One panel for each environment meter. Shown only when the station has one. |
|
Numeric |
Acquire a burst of samples and view it as a waveform, a histogram and a spectrum, with statistics. |
|
Bus |
Send raw I²C, SPI, UART and socket transactions and look at what comes back. |
|
Calibration |
View and edit each module's calibration table (gain and offset). |
|
Alias files |
Activate, replace and delete alias files, and choose which load at start-up. |
|
Extensions |
Load and unload extension modules. |
|
Start-up |
Edit the station's start-up configuration. Changes apply the next time the hardware app starts. |
|
Logs |
The hardware app's log and the audit log, with filters. |
|
Files |
Browse the station's own folders: configuration, alias files, state machines, media, extensions and logs. |
|
System |
The station's services, reboot and clock. |
|
Firmware |
See the installed firmware and install a new release. |
|
Reset… |
Reset the hardware app. See Resetting the hardware app below. |
|
API |
Opens the API reference in a new browser tab. |
The pages for PoE, Audio and Environment appear by themselves when the station has that instrument. If you load or unload a module, the menu updates.
At the bottom of the side menu:
-
Light theme / Dark theme switches between the dark and light look. The Web UI starts in the dark theme. Your choice is remembered in this browser.
-
Collapse shrinks the side menu to a strip of icons, to give the page more room. Click it again to expand the menu. Hover over an icon to see its name. Your choice is remembered in this browser.
On a phone or a narrow window (below about 960 pixels wide), the side menu is hidden. Tap the menu button in the top bar to slide it in. It closes by itself when you pick a page, or when you tap outside it.
Status bar
The status bar at the bottom of every page shows:
-
Connection state, on the left. Hover over it to see the details of any error. On a phone, only the coloured icon is shown.
-
Connecting: the Web UI has not had an answer from the station yet.
-
Connected (green): everything is working.
-
Hardware app offline (orange): the station answers, but its hardware app is not running or not reachable.
-
WebApi unreachable (red): the station does not answer. Check the network and that the station is powered.
-
-
Module chips, one for each module in the backplane, labelled with its address and name, for example
0.2followed by the module name for the module in slot 2. Hover over a chip to see the product ID, serial number and revision. Click a chip to open the Channels page filtered to that module's channels. -
Host name and firmware version, on the right.
Overview page
The Overview page is the first page you see.
Connection card
-
The connection state, as in the status bar. If there is an error, its text is shown below.
-
Host: the station's host name.
-
Firmware: the installed firmware version.
-
IPv4: the station's IP address.
-
MAC: the station's network hardware address.
Modules card
-
Lists every module in the backplane, in slot order.
-
Each entry shows the slot number and module name, then the product ID, revision and serial number.
-
Click the refresh button to read the modules again.
-
If no modules are found, the card says No modules found in the backplane.
Resetting the hardware app
-
In the side menu, click Reset….
-
Read the confirmation. The engine and every module are reset. Outputs go to their reset state, and anything running on the station is interrupted.
-
Click Reset to go ahead, or cancel to leave everything as it is.
A message at the bottom of the screen tells you when the reset is done, or why it failed.
Read-only mode
A test station or another program can take control of the station. While it holds control, a yellow banner across the top of every page says:
Read-only: <holder> holds the station. Values still update; changes are refused until the lease ends.
-
You can still look at everything. Live values keep updating.
-
Changes are refused until the other client lets go. The banner goes away by itself when it does.
The API link
Click API at the bottom of the side menu to open the station's API reference in a new tab. The API runs on port 5000 of the same station, for example http://accordion-01:5000/. Use it when you want to control the station from your own scripts or test software.
Quick start
-
Type the station's host name or IP address in your browser.
-
Check that the status bar says Connected.
-
On the Overview page, check that every module you expect is listed.
-
Click a module chip in the status bar to see that module's channels.
-
Set or read a channel value on the Channels page.
-
To follow a signal over time, open the channel's menu and click Show in chart.
Tips
-
Bookmark the station's address in your browser.
-
Several people can have the Web UI open on the same station at the same time.
-
Settings such as the theme, the side menu, the column layout and the chart are stored in your browser. Another browser or computer starts with the defaults.
-
On a phone, hold your finger on a row to open its menu, just like a right-click on a computer.
-
If the status bar says WebApi unreachable, the Web UI keeps trying. It reconnects by itself when the station answers again.