
The instrument pages give you a front panel for the instruments on your station. You can set and switch power-supply outputs, run PoE testers, record and play audio, watch environment meters and capture waveforms with the Numeric page.
Each page is built from the instruments your station's modules report. You see only the outputs, ports and readings your hardware has.
Accessing
-
Open a browser and go to
http://<hostname-or-IP>/of your station. Firmware 6.0 or later is needed. -
Select a page in the side menu.
Some pages only appear in the menu when your station has the matching hardware:
-
Power and Numeric are always in the menu.
-
PoE appears when the station has a PoE tester.
-
Audio appears when the station has audio devices.
-
Environment appears when the station has an environment meter.
The menu updates by itself when a module is loaded or unloaded.
When another client holds the station (for example a running test script), the pages show who holds it. Controls that change the hardware are disabled or wait until the station is free.
Power
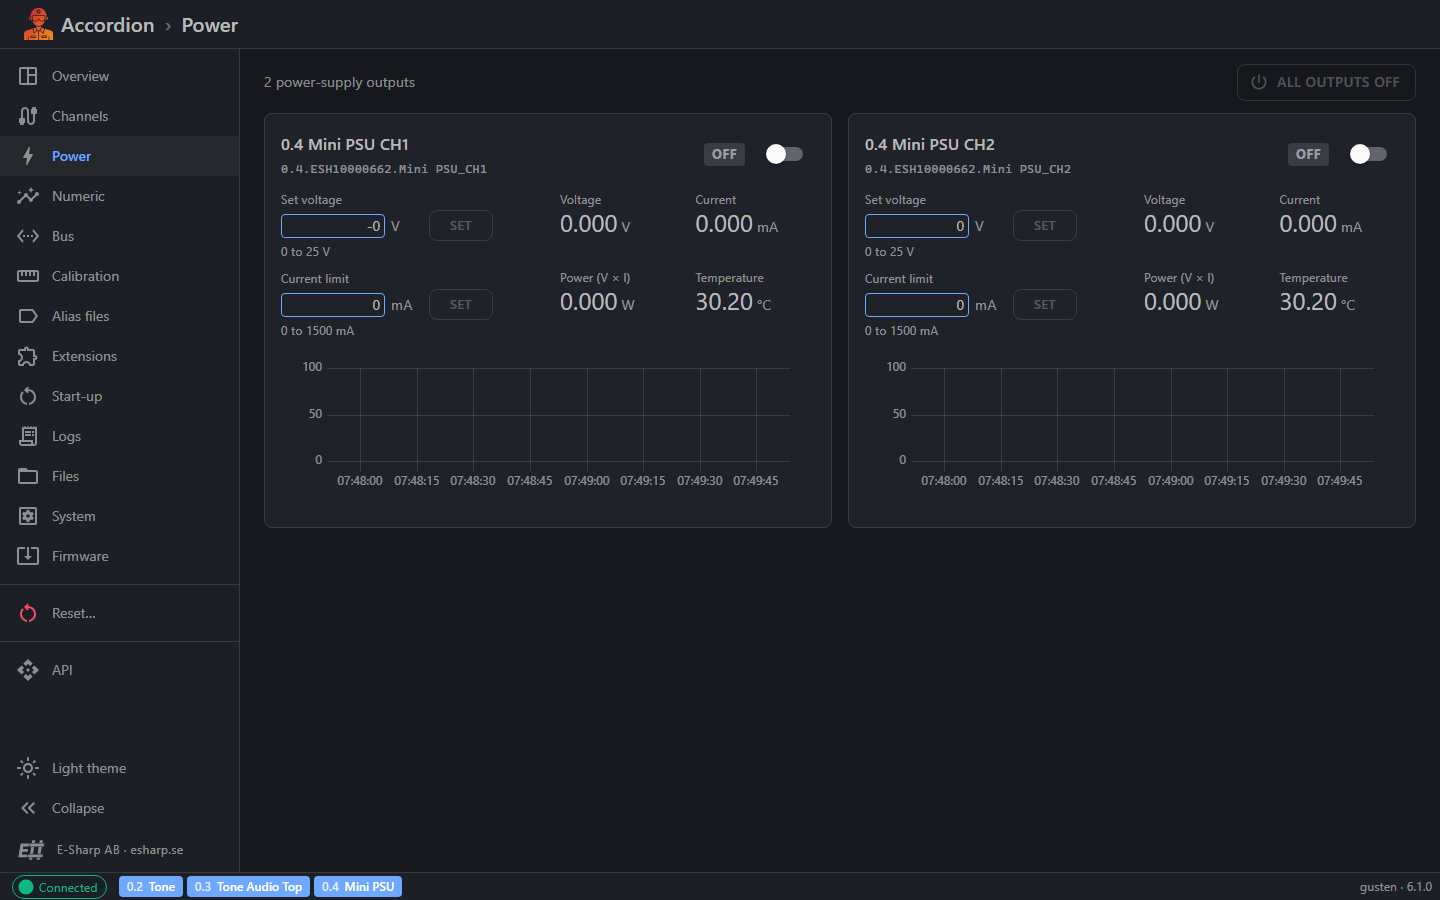
The Power page shows one panel for each power-supply output on the station. Outputs are listed by slot, then by name, so CH1 comes before CH2. The top of the page shows how many outputs there are.
What each panel shows
-
Title: the module's slot and name, and the output name.
-
ON/OFF state and a switch to turn the output on or off.
-
Set voltage and Current limit boxes, with the allowed range shown below each box.
-
Readings: measured voltage, current and power. Temperature is also shown when the supply reports it.
-
Chart: the last two minutes of voltage (left axis) and current (right axis).
A panel shows only the controls the supply has. For example, a supply without a current limit shows no current-limit box.
Power is the measured value when the supply reports it. Otherwise the panel shows Power (V × I), calculated from the voltage and current readings.
Set the voltage or current limit
-
Type the new value in Set voltage or Current limit.
-
Press Enter or click Set.
-
The value is not sent while you type. It is sent only when you press Enter or click Set.
-
Press Esc to discard what you typed.
-
You can use a comma or a point as the decimal separator.
-
A value outside the range shown below the box is refused, and the panel tells you the allowed range.
-
If the box shows Fixed on this supply, that setpoint cannot be changed.
Turn an output on or off
-
Click the switch in the top-right corner of the panel.
-
When you turn an output on, a dialog shows the voltage and current limit it will use. Click Turn on to confirm, or Cancel.
-
Turning an output off happens at once, without a question.
-
If you typed a setpoint but did not set it, the dialog warns you. The output uses the values already set, not the ones in the boxes.
Whatever is connected to an output is powered as soon as you turn it on. Check the setpoints in the dialog before you confirm.
Turn all outputs off
Click All outputs off at the top of the page. Every output that is on is turned off. The button is disabled when no output is on.
Readings and update rate
The page reads the outputs while it is open. It uses the update interval you set on the Channels page.
PoE
The PoE page shows one panel for each PoE tester on the station.
Tester status and readings
-
PoE available or No PoE: whether PoE power is present on the input.
-
PoE controller off: the PoE controller starts only when the PoE input is above 42 V. Until then, the ports show only the basic measurements.
-
Tester readings, when available: PoE input, controller input, controller temperature, total power and total current.
Tester actions
-
Clear peaks: resets the peak and lowest current values.
-
Enable detection: turns on detection and classification on every port.
-
Restart classification: restarts detection and classification on every port.
-
Reset all…: resets the PoE controller. Every port loses power and starts over with detection and classification. You are asked to confirm first.
-
Polarity: selects the PoE polarity. You are asked to confirm first. You cannot change the polarity while a port is powered.
Ports
Each port has its own section:
-
Power good and Enabled indicators.
-
Operating mode buttons. Click a mode to set it for that port.
-
Readings, when available: current, peak, lowest, power, port voltage, class, requested class, detection, detect resistance, police limit and power-on fault.
-
A small trend line next to current and power.
-
Detection event and Classification event indicators.
The page reloads the panels when the PoE controller starts or stops, so ports and controls appear as soon as they are available.
Audio
The Audio page records and plays sound on the station's audio devices. Files are kept in the station's media folder.
Record a file
-
In Record, select the capture Device.
-
Set the Length in seconds (1 to 20).
-
Select a Sample rate, if the device offers a choice.
-
Set the Volume in dB with the slider.
-
Type a File name. The
.wavextension is added for you. -
Click Record. A progress bar shows the recording.
If a file with the same name exists, you are asked before it is replaced. When the recording is done, the new file is selected for playback.
Play a file on the station
-
In Play on the station, select the playback Device.
-
Select a File.
-
Set the Volume in dB.
-
Click Play.
Manage recordings and sounds
The Recordings and sounds list shows the .wav files in the media folder. For each file you can:
-
Listen (headphones icon): play it in your browser.
-
Download: save it to your computer.
-
Delete: remove it from the station, after you confirm.
Click Upload to add .wav files from your computer. Click the refresh icon to reload the list.
Environment
The Environment page shows one panel for each environment meter on the station.
-
The main readings are shown large: temperature, relative humidity, pressure (in hPa) and absolute humidity.
-
Each main reading has a small trend line and the lowest and highest recent values.
-
Click the chart icon on a main reading to add it to the Chart Viewer.
-
Any other readings the meter has, such as dew point, peaks or air quality, are listed below in a table.
The page reads the meters while it is open, at the update interval set on the Channels page. A meter measures every 2 seconds by default, so a faster update interval repeats the same value.
Numeric
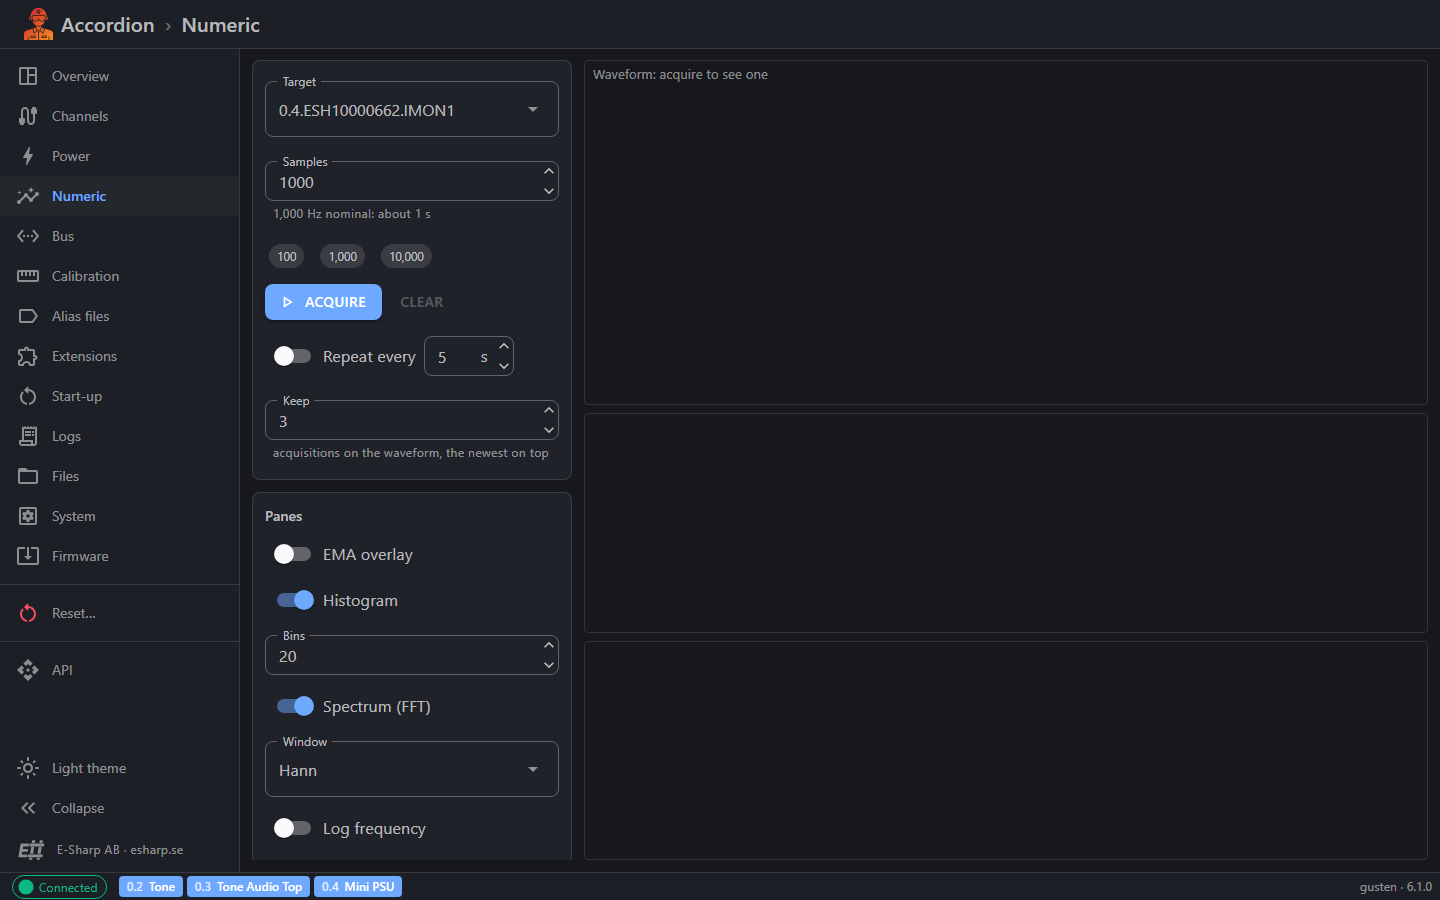
The Numeric page acquires a burst of samples from a numeric-result channel. It shows the result as a waveform, a histogram and a spectrum, with statistics.
Acquire a waveform
-
Select a Target: the signal to sample.
-
Set the number of Samples (1 to 100,000), or click a preset: 100, 1,000 or 10,000. The hint below shows about how long the acquisition takes.
-
Click Acquire.
The first time in a browser session, you are asked to confirm. Acquiring sets the numeric-result channel to your target and sample count. Anything else that uses that channel finds it as you left it.
You can also open this page from the Channels page with Acquire waveform… on a channel. The target is then selected for you.
Repeat and keep acquisitions
-
Turn on Repeat every and set an interval (1 to 3600 seconds) to acquire again and again.
-
Keep sets how many acquisitions (1 to 10) stay on the waveform. The newest is drawn on top.
-
Click Clear to remove all acquisitions from the chart.
Panes
-
EMA overlay: draws a smoothed line over the newest waveform. A lower EMA α is smoother.
-
Histogram: shows the value distribution. Set the number of Bins (2 to 200).
-
Spectrum (FFT): shows the frequency content. Choose the Window (Hann or None), and turn on Log frequency, Log magnitude or dB as needed. The pane title shows the peak frequency.
The panes are calculated in your browser. Changing a pane setting never starts a new acquisition.
Zoom
-
Drag on a pane to zoom in.
-
Hold Shift while you drag to keep the horizontal range. Hold Ctrl to keep the vertical range.
-
Double-click to show the whole range again.
Statistics
After an acquisition, the Statistics panel shows samples, sample rate, duration, min, max, range, mean, median, standard deviation (σ), RMS, skewness and kurtosis.
Enter the lower and upper specification limits in LSL and USL to also see Cp and Cpk. The limits are drawn on the histogram. You can change them without acquiring again.
Export
-
CSV: saves the newest acquisition as time (in seconds) and value.
-
PNG: saves an image of the visible panes.
Tips
-
Use All outputs off on the Power page to make the station safe quickly.
-
Check the range below a setpoint box before you type a value.
-
If a menu item you expect is missing, check that the module is loaded. The menu shows only pages for the hardware you have.
-
Your Numeric settings (target, sample count, panes and limits) are remembered in your browser.
-
Change the update interval on the Channels page if the Power, PoE or Environment readings update too slowly or too often.