

The Audio analyser page turns a Tone Audio Module (ESH10000560) into a two-channel audio generator and analyser in your browser. You set a test signal on each output, choose which input each channel measures, and read level, frequency, THD+N and SNR live, together with a spectrum, a waterfall and a scope view of the signal.
The module does all the signal processing itself at 96 kSps and 24 bit. Only settings and results travel between the module and your browser.
Accessing
-
Open a browser and go to
http://<hostname-or-IP>/of your station. Firmware 6.5 or later is needed. -
In the side menu, open Instrument Panel and click Audio analyser.
Audio analyser appears in the menu when the station has a Tone Audio Module. Each module has its own panel, titled with its slot and name, for example 0.2 Tone.
When another client holds the station (for example a running test script), controls that change the hardware are disabled or wait until the station is free.
The page at a glance
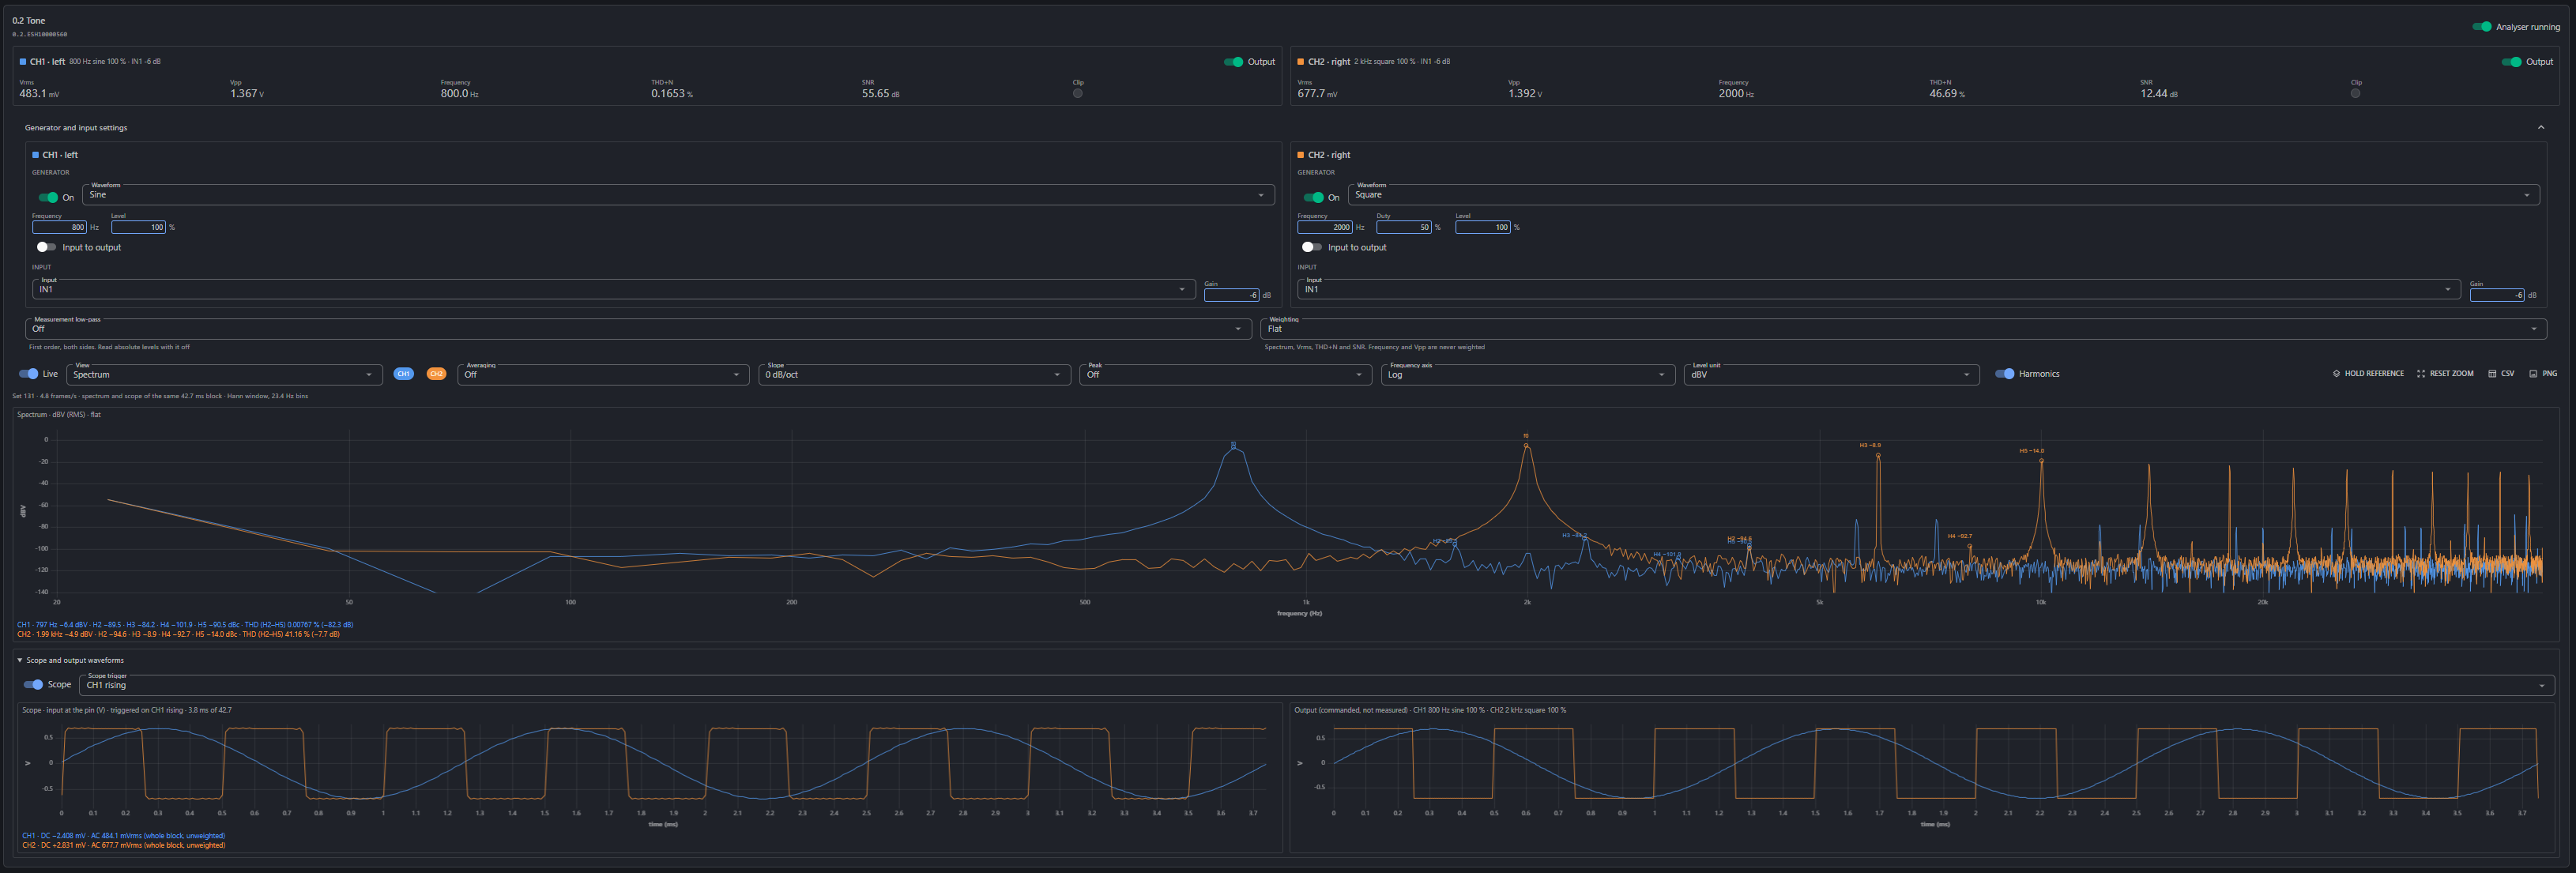
From top to bottom the page has:
-
Channel readings: one panel each for CH1 left and CH2 right, with the live measurements and the channel's Output switch.
-
Generator and input settings: what each channel generates, which input it measures, and the measurement filters. Click the header to fold the section away.
-
Analysis view: the spectrum or the waterfall, with the controls for how it is drawn and exported.
-
Scope and output waveforms: the measured input signal in time, next to the signal the outputs are set to produce.
The Analyser running switch in the top-right corner starts and stops the measurements.
Channel readings
Each channel panel shows a summary of its settings next to the name, for example 800 Hz sine 100 % · IN1 −6 dB, and these readings:
|
Reading |
What it is |
|---|---|
|
Vrms |
RMS level of the input signal, at the input pin. |
|
Vpp |
Peak-to-peak level of the input signal, at the input pin. |
|
Frequency |
Frequency of the strongest tone in the input. |
|
THD+N |
Total harmonic distortion plus noise, in %. |
|
SNR |
Signal-to-noise ratio, in dB. |
|
Clip |
Turns red when the input signal reaches the top of the measuring range. The other readings are not reliable while it is red. |
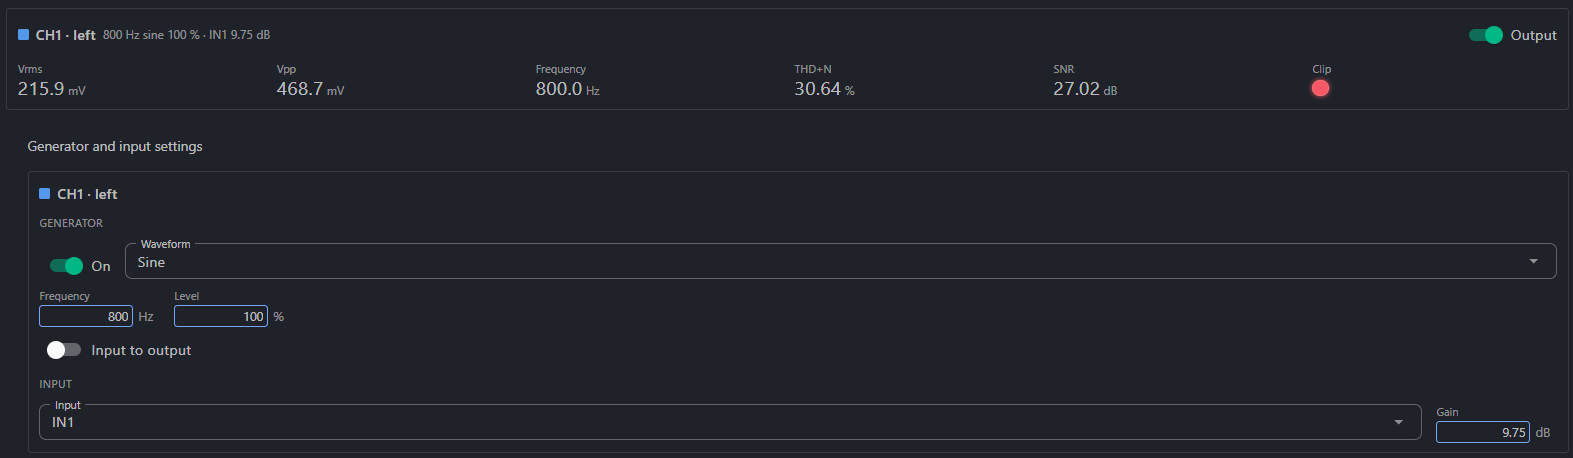
The Output switch turns the channel's output jack on or off. The generator keeps running while the output is off, so you can prepare a signal before you send it to the device under test.
The readings are also channels on the station, for example 0.2.ESH10000560.MEAS1_THD. Add them to the Chart Viewer from the Channels page to follow a measurement over time.
Generator and input settings
Generator
Each channel has its own generator:
-
On: turns the generator on or off.
-
Waveform: Sine, Square, Triangle, White noise, Pink noise or Sweep.
-
Frequency: in Hz.
-
Duty: in %, for the square wave only.
-
Level: in % of the full output level.
-
Input to output: also sends the channel's input signal to its output, in addition to the generator.
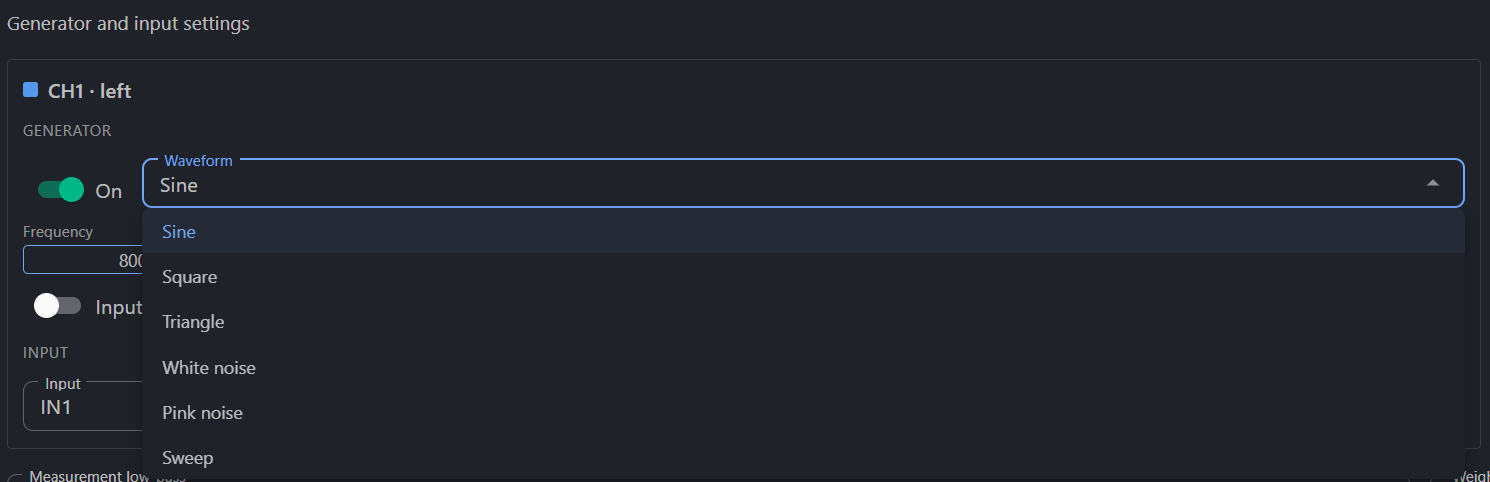
Sweep sweeps the generator in frequency. Use it with the Sweep response peak setting to see how the device under test responds across frequency.
At 100 % level a sine wave on the output is about 1.4 V peak to peak (0.49 Vrms).
Input
-
Input: which input pair the channel measures, IN1 to IN4. CH1 measures the left jack of the pair and CH2 the right jack. Both are sampled at the same time.
-
Gain: the input gain in dB. −6 dB is the normal setting. Raise it to measure small signals, and lower it again if Clip turns red.
Gain acts on IN1 and IN4 only. IN2 and IN3 are measured at a fixed gain, and the Gain box has no effect on them.
Measurement filters
-
Measurement low-pass: a first-order low-pass filter on both channels: Off, 24 kHz, 20 kHz, 16 kHz, 10 kHz, 5 kHz, 2 kHz or 1 kHz. Use it to keep noise above your band out of THD+N and SNR. Turn it off when you read absolute levels: a first-order filter already lowers the level below its corner frequency.
-
Weighting: Flat or A-weighted. Weighting applies to the spectrum, Vrms, THD+N and SNR. Frequency and Vpp are never weighted.
Analysis view
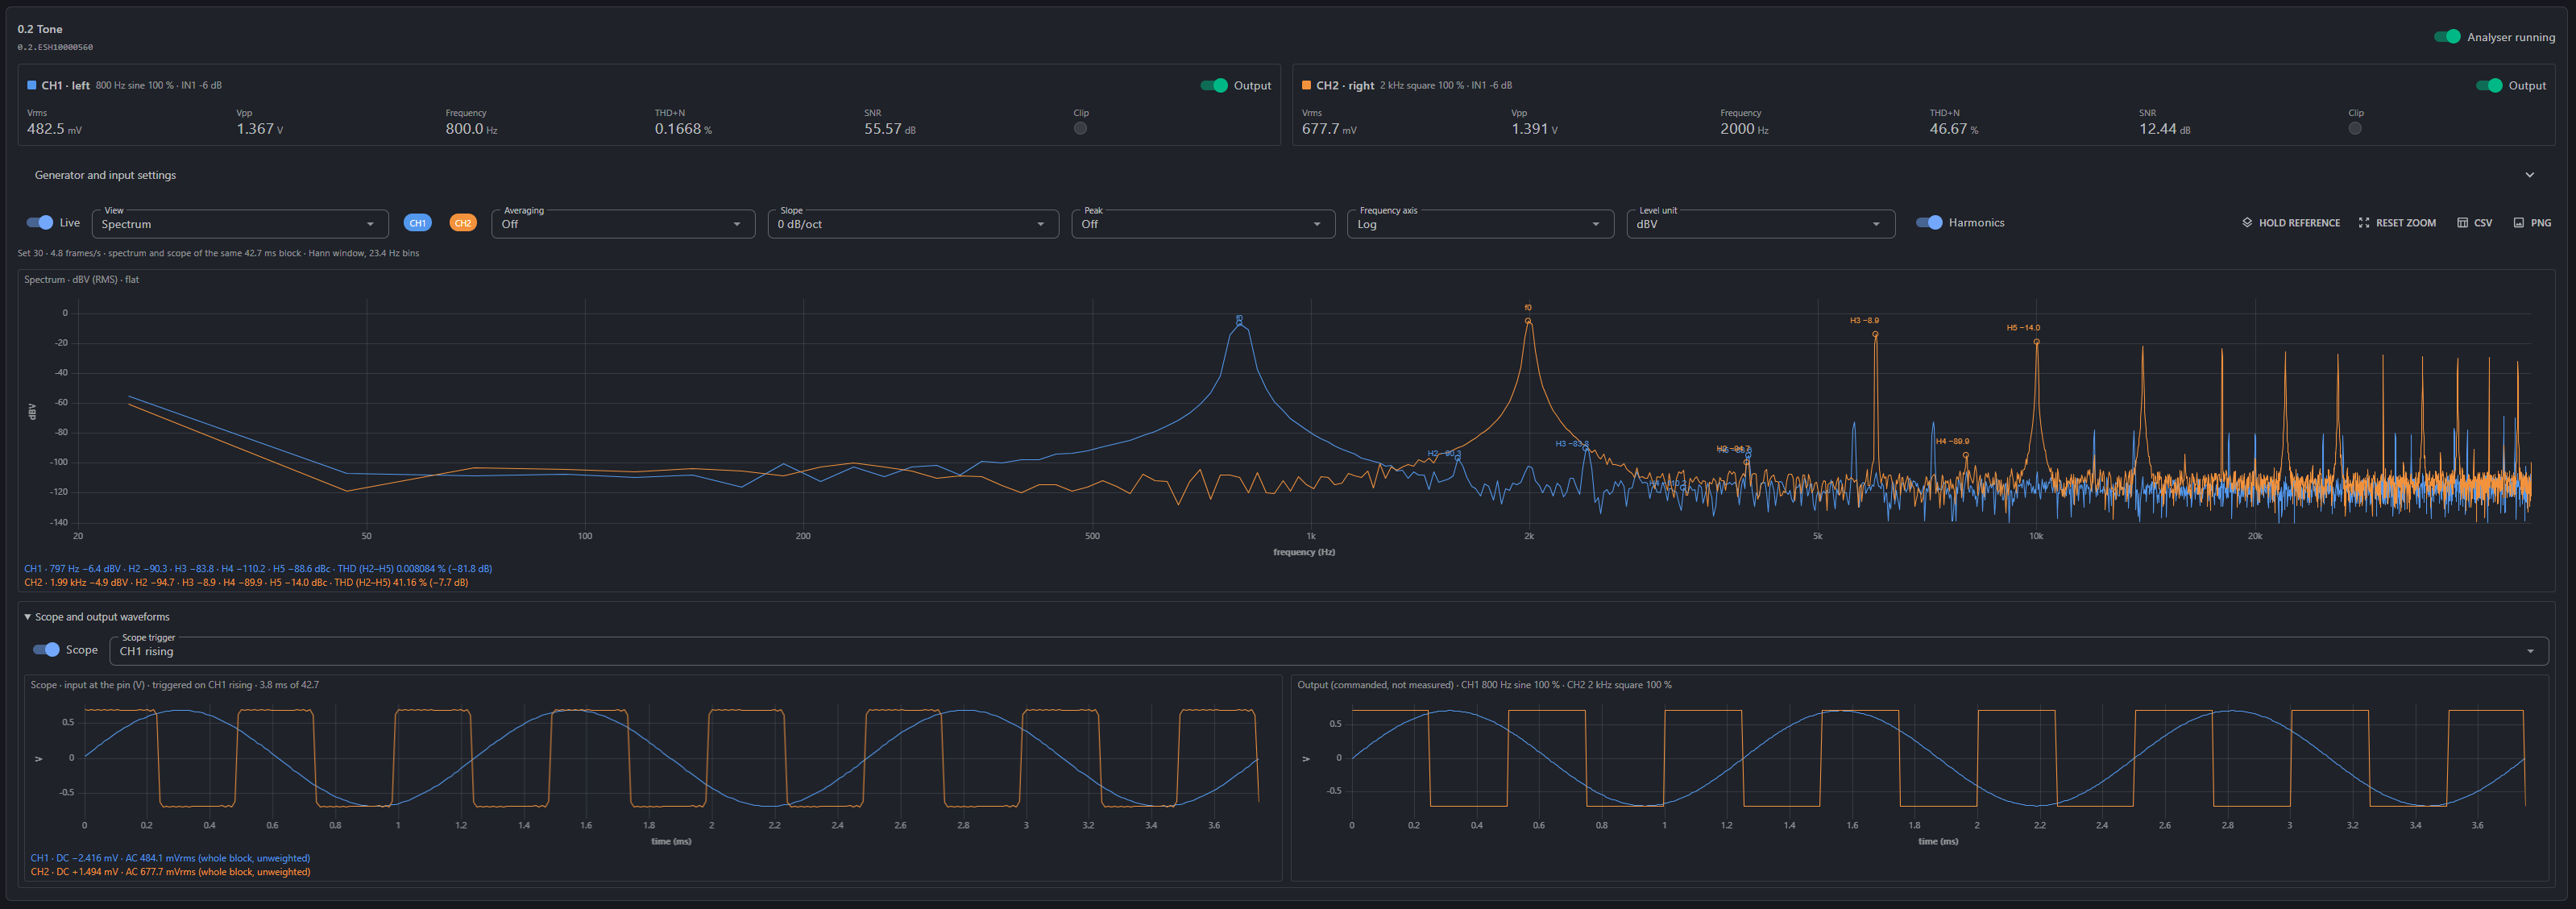
The toolbar above the chart:
-
Live: updates the chart continuously. Turn it off to freeze the current picture.
-
View: Spectrum or Waterfall (see below).
-
CH1 and CH2: show or hide each channel's trace.
-
Averaging: Off, or the average of 2, 4 or 8 frames. Averaging steadies a noisy trace. The chart title shows the averaging in use.
-
Slope: tilts the spectrum by a number of dB per octave.
-
Peak: draws a dashed peak trace over the live one (see below).
-
Frequency axis: logarithmic or linear.
-
Level unit: the unit of the vertical axis, for example dBV.
-
Harmonics: marks the fundamental (f0) and the harmonics H2 to H5 on the chart, with their levels.
-
Hold reference: keeps the current trace on the chart as a reference to compare against.
-
Reset zoom: shows the whole range again.
-
CSV and PNG: save the data or an image of the chart.
The line under the toolbar shows the update rate and the analysis settings, for example 4.8 frames/s · 42.7 ms block · Hann window, 23.4 Hz bins.
With Harmonics on, the lines under the chart list, for each channel, the fundamental and the level of each harmonic, and THD over H2 to H5.

Peak
The Peak setting draws the highest level seen at each frequency as a dashed trace:
-
Last 3 frames, Last 5 frames or Last 10 frames: the peak over the most recent frames.
-
Max hold: the peak since you turned it on. The chart title shows when it started. Click Reset hold to start again.
-
Sweep response: the response while the Sweep waveform runs.

Waterfall
The Waterfall view shows the spectrum over time, one strip per channel. The newest spectrum is at the top and older ones move down. The colour gives the level, on the scale at the right (−140 to +10 dBV). Use it to see a level that drifts, a tone that comes and goes, or interference that appears now and then.

Scope and output waveforms
Turn on Scope to see the signals in time:
-
Scope (left): the measured input signal at the input pin, in volts. The readout below gives the DC level and the AC RMS level of each channel over the whole block.
-
Output (right): the signal the outputs are set to produce. It is drawn from the settings, not measured.
Scope trigger sets what starts the trace, for example CH1 rising, so a repeating signal stands still on the screen.
Example: measure the unit on itself
A loop-back cable from each output to an input checks the whole audio path.
-
Connect OUT L (J13) to IN1 L (J4), and OUT R (J12) to IN1 R (J5), with SMA cables.
-
In Generator and input settings, set CH1 to a 1 kHz sine at 100 %, and set Input to IN1 with a gain of −6 dB. Do the same for CH2.
-
Turn on Output for both channels.
-
Read about 0.49 Vrms and 1.4 Vpp on each channel. The frequency reads 1 kHz, and the spectrum shows one clear peak at 1 kHz.
Measurement range and limits
-
The measurements are valid from 50 Hz to 20 kHz.
-
All inputs and outputs are line level. On IN1 and IN4, keep the input at or below 0.7 Vrms (0.85 Vrms maximum) at −6 dB gain. On IN2 and IN3, keep it at or below 0.35 Vrms (0.50 Vrms maximum).
-
A square wave reads a high THD+N, for example about 47 %. That is expected: its harmonics are part of the signal.
-
The edges of a generated square wave ring slightly (about 9 % overshoot). This comes from the converter's filter and is normal. A square wave above about 91 % of full scale can turn Clip red for the same reason.
-
An unconnected input picks up a little of the neighbouring input. Terminate inputs you do not use when you measure low levels.
Tips
-
Fold away Generator and input settings once the signals are set, to give the chart more room.
-
Use Hold reference before you change something on the device under test, to see the difference directly.
-
Turn off Output before you change the fixture wiring.
See also
E-Sharp AB (E#) · Götgatan 3, 244 32 Kävlinge, Sweden · https://www.esharp.se
Author: Gustav · Date: · Revision: 0
This document was prepared by Gustav with the assistance of AI.